
Introduction
NodeXL Basic is a free and open-source network analysis and visualization software package for Microsoft Excel 2007/2010/2013/2016. (Wikipedia, 2016)
It is in short, a visualisation plugin for Microsoft Excel that takes data from different social media outlets and puts it together in groups depending on the user requirements. This helps in identifying gaps in businesses that rely on social media as a means for marketing. Using this tool, one can see who is exactly talking about their products/services/business and with this information, the company can target all those who are talking about the business and encourage them to influence all the others that are not talking about the business.
Setting Up
- Go to the nodexl.org website and download the plugin. Find it at: https://nodexl.codeplex.com/downloads/get/806203. It automatically comes up a download link for NodeXL
- Once downloaded, double click on the file. This automatically puts it as a plugin in excel.

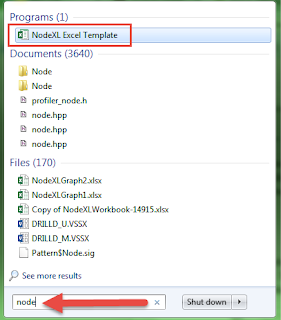
3. To start, go to start->search and then type in "node" and it should show up as below
Getting Started
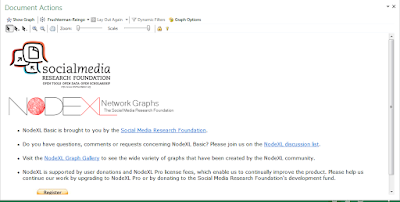
- Open the excel template for nodeXL.
- Wait for it to finish loading up.
- Once the application has loaded, you should see the below:
4. To start with your search for a trending topic, go to the NodeXL basic tab on the ribbon. Then choose import. See below:

5. In the options, you will see where you should enter 1. the trending term, 2. Check if your already gave the application the chance to use your twitter settings and 3. the number of tweets to bring back. For the basic version, only maximum 2000 tweets are allowed. See below image:


7. The next part is to group the data together. Go to 1. Groups and then 2. choose cluster. This will cluster all the data that is the same together. See Below:


Conclusion
NodeXL is a very useful tool for marketers of to find sentiment among a large network. It is not only limited to Twitter, it also caters for Facebook and Flicker as well.
In the above final image, we used the rocking ribs promo that Spur was using. As can be seen, there was a huge conversation and people tweeting about it. NodeXL also shows who is saying what and therefore, the concerned party can actually see what people are saying about their product.