Thursday, 7 July 2016

NodeXL: A way to show engagement

Introduction


NodeXL Basic is a free and open-source network analysis and visualization software package for Microsoft Excel 2007/2010/2013/2016. (Wikipedia, 2016)

It is in short, a visualisation plugin for Microsoft Excel that takes data from different social media outlets and puts it together in groups depending on the user requirements. This helps in identifying gaps in businesses that rely on social media as a means for marketing. Using this tool, one can see who is exactly talking about their products/services/business and with this information, the company can target all those who are talking about the business and encourage them to influence all the others that are not talking about the business.

Setting Up 

  1. Go to the nodexl.org website and download the plugin. Find it at: https://nodexl.codeplex.com/downloads/get/806203. It automatically comes up a download link for NodeXL
  2. Once downloaded, double click on the file. This automatically puts it as a plugin in excel.

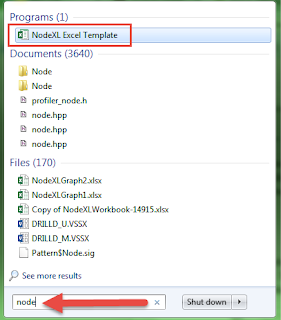
         3. To start, go to start->search and then type in "node" and it should show up as below


 Getting Started

  1. Open the excel template for nodeXL.
  2. Wait for it to finish loading up. 
  3. Once the application has loaded, you should see the below:
 

    4. To start with your search for a trending topic, go to the NodeXL basic tab on the ribbon. Then choose import. See below:


   5. In the options, you will see where you should enter 1. the trending term, 2. Check if your already gave the application the chance to use your twitter settings and 3. the number of tweets to bring back. For the basic version, only maximum 2000 tweets are allowed. See below image:

    6. Press OK. This will take a while to populate all the relevant  sheets in the application. Once it is done with that,you can do some analysis. 1. Go to the NodeXL basic tab again then 2.graph Metrics. A dialog opens and in the dialog, choose select all and 4. Press Calculate Metrics. See Below:


    7. The next part is to group the data together. Go to 1. Groups and then 2. choose cluster. This will cluster all the data that is the same together. See Below:

     8. Then just press the show graph option on the ribbon in the NodeXL Basic tab on the ribbon. The initial graph you will see will be mashed up so you will need to add some more detail. As from the below image, to get something like this, you just have to play around with the Graph options as well as the layout options


Conclusion

NodeXL is a very useful tool for marketers of to find sentiment among a large network. It is not only limited to Twitter, it also caters for Facebook and Flicker as well.

In the above final image, we used the rocking ribs promo that Spur was using. As can be seen, there was a huge conversation and people tweeting about it. NodeXL also shows who is saying what and therefore, the concerned party can actually see what people are saying about their product.

Thursday, 23 June 2016

Heroes and villains – Different but the same

Introduction


In this post, I will be discussing something that is different from what I usually crap on about. This is something that has nothing to do with politics. Something to do with super heroes and most importantly, the villains. Villains are usually frowned upon. They are the evil that should be expunged from the earth and be put away somewhere far away where they cannot harm any innocence. But have you ever thought from the side of the villain? Usually we want and thrive when villains in movies and books are destroyed and killed but in comics, this is usually not the case.

Super heroes never want to take the lives of villains. There are a number of factored in my opinion that explain this phenomenon. For one, heroes need villains and villains need heroes. It is basically ying and yang, opposites of the same coin. Another reason is that, heroes understand villains, they sympathise with the villains on a level that we the innocent, would never understand. They know where the villains have been and they are willing to save them or try to save them. In this post, I will discuss both of these points of the hero vs villain.

Like Campbell’s hero journey, the hero goes through a number of transitions himself before he is who he is at the end of the journey. These stages are: “Departure”, “Initiation” and “Return”. These stages are for heroes and could equally be applied to the villain. The same stages that a hero goes through, a villain goes through but in the case of the villain, the opposite effect happens.


Campbell’s Hero Journey?


The hero journey has a total of 7 stages. These are categorised by the abovementioned stages. In the Departure stage, we have: The call to adventure, refusal of the call, supernatural aid, crossing the threshold and belly of the whale. 

The Initiation stage include: The road of trials, the meeting with the Goddess, Women as Temptress, atonement with the father, Apotheosis and the ultimate Boon. The Last category, Return, include: Refusal of the return, the magic flight, rescue from without, the crossing of the return threshold, master of two worlds and freedom to live. 

For the above, the original Star Wars trilogy is a good example as well as the first Matrix movie.
A whole essay could be written, and I have, on Campbell’s hero journey and it is important to read up on it if some of the things I cover do not make much sense. I briefly touched on it because it is important for analysis.


Who needs who?


So in this world of good versus evil. Who exactly needs whom? In my opinion, they need each other. Without villains, there can be no heroes. Without heroes, there can be no villains. And in fact, the more powerful the hero, the more powerful villain is needed. Think of it this way, if Spiderman only had petty thieves and care robbers to stop, he would never grow his powers. He could never grow in imagination and thinking. He would eventually get bored and be the villain himself. Without a challenge, one’s life becomes boring, uneventful and meaningless. We can all use this in our lives. Challenges and hardships are important in order for a person to grow.

The villain as well, needs the challenge of beating the hero. After every defeat, the villain learns from his mistakes and uses this to better himself. Albeit, an evil road, the villain does not see what he does as evil, instead, he sees this growth. As contributing to the very nature of life. Contributing to the balance that is the life. In conclusion, the hero needs the villain and vice versa. You cannot have one without the other.


Understanding the Villain


In most comics, the villain never truly dies. They always come back. It is only recently in comic book movies that the villain dies. This for all intents and purposes is a mistake by the movie makers. Heroes should never and don’t kill villains because truly, the heroes see themselves.

Let me explain what I mean with an example. Spiderman was born of his parents. His parents died and he was raised by his aunt and uncle. His uncle and aunt then became his moral centres where he could learn wrong from right. Imagine if instead of his aunt and uncle, Peter Parker was raised in an orphanage or by an uncle who abuses him all the time. Would he still be the same Peter we know who knows right from wrong?

In all the hero origins, the villains come from some place that is broken and eventually get to where they are. There is a deep seeded need for acceptance and belonging. The super hero understands this need and tries to show the villain the error of his ways. A good example of this is in Dragon Ball Z whereby Goku, no matter how evil his opponent, always tries to appeal to their good side. This is because he knows that the villain was not born that way, it is but circumstances that have led to this.

So next time you see a villain, remember that there could be a deeply soul crushing story that has led to that. Nobody is born evil, it the events in our lives that shape who we turn into. The same can be said about life. One’s life is shaped by their environment, if you were born with a silver spoon in your mouth, chances are, and you will go through life without so much challenges. But if you were born in a shack, life becomes harder and changing your circumstances, especially if you have no talent and are academically weak, becomes that much harder.

Conclusion


Villains are not born, they are made. From the moment we are born as humans, we face challenges that are contributed to by the environments that we are in. An environment can mould you into greatness, heroism or into a villainous life filled with pain and anguish. 

Villains can teach us many things about life. They are the model that shows us everything that is wrong with the world. Heroes come in and try to make the struggle of the villain more visible. Without heroes, villains would be somewhat unpresentable to the world. Villains and heroes indeed need each other, worthy villains bring out the best in heroes and vice versa.

Tuesday, 14 June 2016

Why Neo Is Not The One (A Matrix Review)

Introduction

The Matrix trilogy is by far, one of my favourite, all time movies' series. The themes that are discussed and potraited especially make it a remarkable movie. If your in Computer Science, the movie resonates even more with you. In this post, I will be discussing the issue of The One. Many say that The One is Neo. It is even in his name. A clever anagram of the words "one". Neo has thought of as being The One. I beg to differ.

Some even claim that The One is Smith. The overbearing agent who cheated death and took over the Matrix. Most claim that it is he, who is truly the one. Again, I beg to differ with these assertions. In this post, I will reveal who I think is The One but I will also discuss Neo being The One as well as Smith being The One and then at the end, I will reveal who The One is. This is my opinion and is based on what I have seen. So if you disagree, the comments section is the place to discuss this.


Neo As The One


From the first movie, it has been thought that Neo is The One. I mean, he is the star of the movie after all. The Matrix movies, however, are based on the story of Jesus Christ. So if Neo is Jesus, then where is John the Baptist. You cannot claim that Morpheus is John either.

In the first movie, the Oracle even tells him that he is not The One. Although she told Trinity that she would fall in love with The One, that was the only characteristics that Neo abides by. Even that, a girl with a crush could have misunderstood the Oracle's message. It is only human to misunderstand messages.

An important thing to note as well, is when Morpheus said that when the Matrix was first created, there was a man born in it who was not constrained by the makings of the Matrix. He could change anything he wanted in the Matrix. Where in the whole Matrix series has Neo ever changed anything. He can fly, beat a few agents and is faster and stronger but that is about it. There is nothing he changes in the Matrix.

It is why, in my opinion, that I declare Neo as the John the Baptist character in the series. Like many in biblical times who thought that John was the messiah, in this case, Neo fits that label. Although, I think initially, the Wachowaski Brothers (Creators of the movies) made him The One. I doubt they thought that they would actually make a trilogy. With the trilogy, new ideas must have emerged including the all powerful, ultra cool, Smith virus.

Smith As The One


I am sure many of you are perplexed by this. Well, don't be. You are probably asking yourself how could the enemy actually be the hero of the story? Well, I did not say he was the hero knowingly, I just said that many in the dark, world wide web believe he is The One. Here are some of the reasons for this.

As mentioned in the Morpheus quote in the Neo part, a man who was born in the Matrix. Neo was not born in the Matrix but Smith was. As long as there has been a Matrix, Smith has always been there. He even mentions this in the first movie whereby he tells Morpheus that the first Matrix built was a place of peace whereby nobody suffered. This implies that he was there from the beginning and he has been through all the iterations of the Matrix. As the architect mentions in the second movie, this was the 6th iteration.

Another example of Smith being born from the matrix is, when he tells Neo, in the second movie, that when Neo copied over him, something was left behind. He knew he had to die but couldn't, he resisted dying and now finds himself a new man. This implies rebirth, again, being born in the Matrix.

Smith, copies himself over and essentially changes the Matrix itself. He changes it so much that it cannot be recognised in the final battle with Neo. The architect said, the One's programming carries a code that must be inserted into the Matrix in order for it to reboot. Many believe Neo betrayed Zion when he chose to save Trinity. This indeed is not the case. The ending of the Matrix is even weirder. I often asked myself, how did Neo save Zion, I mean, he didn't kill Smith. Instead, Smith killed Neo.

Well, here is the low down. The machines were losing control of the system. They make a deal with Neo that will essentially get The One to re-insert himself into the primary programming of the Matrix. By coping himself into Neo, Smith essentially inserted himself back into the primary program causing the Matrix to reboot.

My theory has always been that of balance. Neo is the ying to Smith's yang. When Neo first destroyed Smith, ying was created and because the Matrix is a system of balance, a yang had to be created. Therefore, when Smith destroys Neo, the Matrix balanced itself out. Again, this kind of shows how Smith is The One and not Neo. For a detailed reason why Smith is The One, watch this: https://www.youtube.com/watch?v=VkMU1mKdwPI

Who The One Is


There is a character in the series whom is not seen many times. This character is first seen in the final movie. But at the end, is actually the one to say the most significant thing that proves that she is the One. I am talking about the little Indian girl that the Oracle tries to protect from Smith. The one whom made friends with Neo in the train station while trying to help him out and even creates a sunrise for him when Neo dies. Lets give this a quick analysis.

We go back to Morpheus' statement that the One was born in the Matrix. The little Indian girl, Sati, was born in the Matrix. Born to two programs trying to save her from being deleted by the Matrix itself. Every program needs a purpose or else it is deleted. She had no purpose and therefore, was scheduled for deletion. She befriends Neo.

At the scene where Smith is hunting her down, the Oracle seeks to distract him by letting Seriph escape with her. She even gives her a cookie. Many would assume that her role is that she will be the next Oracle. That also makes sense but what blew my mind, was what happened at the end of the movie with the the Sunrise. She sits on top of the Oracle and boldly claims that she created the sunrise for Neo. Then she asks if they will ever seem him again, the Oracle saying she does not know but hopes so.

The above statement is enough to proclaim her as the next Oracle but that does not explain the part of how she created the sunrise. This shows that she can change the Matrix as she sees fit and this is enough to make her the One doesn't it? I believe solely based on that, she is indeed the One.

Conclusion


There is no Zion. The so called "Outside The Matrix" is actually still inside of the Matrix. The architect said that in order to make the Matrix work, some of the people had to think that they are free from the Matrix. To make them actually think that they are fighting the big, bad machines. Example is when Neo stops the machines and then passes out. The Oracle then tells him he was not ready for that and should be dead.

What she really meant is that Neo was not ready to find out the real truth, the truth that they are all still in the Matrix, in some sort of control that they could not escape. Imagine living and fighting all this time, only to find out your still jacked into the very sytem you thought you were free from. Neo knew this and that is why he could not tell the others.

There is no escaping the Matrix, this knowledge would have caused the machines to lose mountains of stock which would ultimately lead to their extinction as well. The Matrix is actually a play on our daily reality. We are all jacked into the Matrix, even those who are not on the grid, are actually on the grid. It is a sick, sadistic reality that we should all accept.
Tuesday, 8 March 2016

Star Schema Vs Snowflake

Introduction


In Datawarehousing, it is often asked, which is better between Star Schema and Snowflake Schema. This is no different in Qlikview whereby the model, is actually one of the most important entity to the whole process. Once the back-end (Where data associations are made) is well scripted, it is seldom that much more work or difficulty of showing relevant data will be a problem in the front-end where the user interacts with the data.

In this post, I will argue which is the best schema to use when it comes to Qlikview. Using arguments from seasoned Qlikview practitioners as well as examples of my own, I will try to show the advantages and disadvantages of both the Snowflake and Star Schemas in terms of:

  1. Practicality
  2. Performance
  3.  

What is a Star Schema?


In computing, the Star Schema is the simplest style of data mart schema. The Star Schema consists of one or more fact tables referencing any number of dimension tables. The Star Schema is an important special case of the Snowflake Schema, and is more effective for handling simpler queries.
The Star Schema gets its name from the physical model's resemblance to a star shape with a fact table at its center and the dimension tables surrounding it representing the star's points. (Wikipedia, 2015)

To summaries the above, a Star Schema, is a structure whereby dimensions are connected via a fact table that is situated in the centre. The fact table will consist of foreign keys of all the dimension tables. The fact table will contain, besides the foreign keys, measures such as total sales, total costs, total number of clients, etc. The dimension tables, will thus have details that describe the dimension further.

Eg: The dimension table Advertiser_dimension, will contain fields such as; Advertiser_id, Advertiser_name, Advertiser_address


What is a Snowflake Schema?


The Snowflake Schema is an extension of the Star Schema, where each point of the star explodes into more points. In a Star Schema, each dimension is represented by a single dimensional table, whereas in a Snowflake Schema, that dimensional table is normalized into multiple lookup tables, each representing a level in the dimensional hierarchy. (Snowflake Schema, 2015)

So unlike the Star Schema, the Snowflake Schema organises data inside the database in order to eliminate redundancy and thus helps to reduce the amount of data. The hierarchy of the business and its dimensions are preserved in the data model through referential integrity.
Eg: The dimension table Account_Dimension, will have numerous detail about the dimension across different tables linked to it.


Performance (Hops)


Most of the Qlikcommunity claim that to minimise the number of hops in a data model significally increases performance of the model. Although this is true to a degree, this is not the be-all and end-all to improve performance. When modelling data, one must also take into consideration, the data itself. You need to take the relevant data. Even from this level, the data practioner has to keep the user in mind and what the users needs are. Without knowing the users needs, the model could spiral into an unforgiving monster. Henric Cronström, A Qlikview developer, claims that minimising the number of hops only affects the performance marginally.


Others argue that the number of hops do affect performance. For example, if you have a model like the above whereby you need 4 hops from the fact table to the last dimension table, that is performance heavy. Take for instance the image below, let's just say you want to show the Salesperson's office city where most of the orders originate in terms of the Supplier and the products he supplies. As the image below shows, this will take four hops to get the data you need. This is performance heavy on Qlikview because the set analysis (Is a way to define an aggregation scope different from current selection) used could get relatively complicated.

In most cases, there is room for a model with many hops. In the image below, this would have been the best way to design the data in order to make the model readable and realiable and not have a combusome model where tables have unrelated fields in them. So it is very important to understand the data and have the model correctly modelled. The general rule of thumb is:
  1. The 80 / 20 rule; 80% of the effort goes into the data and 20% goes into the user interface


Advantages


  • Star Schema


  1. Queries run faster against a Star Schema database
  2. A Star Schema structure reduces the time required to load large batches of data into a database
  3. A Star Schema is designed to enforce referential integrity of loaded data
  4. Navigating through data is efficient because dimensions are joined through fact tables
  • Snowflake Schema


  1. The main advantage of Snowflake Schema is the improvement of query performance due to minimized disk storage requirements and joining smaller lookup tables.
  2. It is easier to maintain.
  3. Increase flexibility.

Disadvantages


  • Star Schema


  1. Data integrity is not enforced as well as it is in a highly normalized database
  2. One-off inserts and updates can result in data anomalies which normalized schemas are designed to avoid.
  3. Is also not as flexible in terms of analytical needs as a normalized data model
  • Snowflake Schema


  1. The main disadvantage of the Snowflake Schema is the additional maintenance efforts needed to the increase number of lookup tables.
  2. Makes the queries much more difficult to create because more tables need to be joined.

Conclusion


In conclusion, one can actually say that both schema's have marit. In Qlikview, the prefered schema is the Star Schema as it provides us with queries that run faster. The structure also allow us to run large batches of data fasted and load data quickly. Users typical do not want to wait for data to display and this is important in Qlikview because it allows business heads to make important, crucial decisions depending on the data. If data takes forever to load, business users will have issues using the tool.
This however, does not completly rule out the use of a Snowflake structure in Qlikview.

There is room also for a Snowflake structure depending on the data iteslf as well as how you want to represent the data. it allow the structure to be easily maintained as dimensions and facts are not bombarded will many fields. This leads to better understanding of the data you are working on.
In the end, choosing an appropriate structure will solely depend on the data and the needs of the business.

References


  1. Snowflake Schema. 2015. Snowflake Schema. [ONLINE] Available at: http://www.1keydata.com/datawarehousing/snowflake-schema.html. [Accessed 07 October 2015].
  2. . 2015. . [ONLINE] Available at: http://cdn.ttgtmedia.com/rms/SearchBusinessIntelligence_IN/Star-vs-snowflake-image-two.png. [Accessed 07 October 2015].
  3. Star schema - Wikipedia, the free encyclopedia. 2015. Star schema - Wikipedia, the free encyclopedia. [ONLINE] Available at: https://en.wikipedia.org/wiki/Star_schema. [Accessed 07 October 2015].
  4. Qlik Design Blog : A Myth about the Number of Hops | Qlik Community. 2015. Qlik Design Blog : A Myth about the Number of Hops | Qlik Community. [ONLINE] Available at: https://community.qlik.com/blogs/qlikviewdesignblog/2015/01/19/number-of-hops. [Accessed 08 October 2015].
  5. Performance w/ multiple fact tables - star sche... | Qlik Community. 2015. Performance w/ multiple fact tables - star sche... | Qlik Community. [ONLINE] Available at: https://community.qlik.com/message/360786#360786. [Accessed 10 October 2015].
  6. . 2016. . [ONLINE] Available at: http://source.entelect.co.za/to-star-or-to-snowflake-in-qlikview. [Accessed 11 March 2016].

Tuesday, 23 February 2016

Qlikview Waterfall Tutorial

“A waterfall chart is a form of data visualization that helps in understanding the cumulative effect of sequentially introduced positive or negative values. The waterfall chart is also known as a flying bricks chart or Mario chart due to the apparent suspension of columns (bricks) in mid-air.

The waterfall chart is normally used for understanding how an initial value is affected by a series of intermediate positive or negative values. Usually the initial and the final values are represented by whole columns, while the intermediate values are denoted by floating columns. The columns are color-coded for distinguishing between positive and negative values.” (Wikipedia, 2015)

https://www.aploris.com/support/documentation/area-waterfall-and-marimekko-chart
Considerations:

1.    Each bar will have a different expression.

2.    The chart can be created without adding any dimensions.

3.    Have an idea as to what you want to show.

4.    Have all the data you need.

Steps:

1.    Open up Qlikview.

2.    Go to the tab that you are working on.

3.    Right click on where you would like to add the chart->New Sheet Object->Chart.

4.    Choose Bar Graph. Click finish.

5.    Go to the chart, right click and choose properties.

6.    Go to expressions.


7.  Add all the expressions that you want to use but make sure the first expression will be the tallest bar. In most cases, it is the overall total of all the expressions. So basically, all the other expressions should add up to the tallest bar. 

      8. Once you have all your expressions and ready to show, Do the following: 

                  a.    Expand the second expression.

b.    Go to the Bar offset.


  c.    In the definition, you will subtract the overall expression (First expression) from the second one (expr1 – expr2).

d.    Expand the third expression.

e.    Go to the Bar offset.

f.    In the definition, you will subtract the overall expression (First expression) from the second one plus the third one. So you will have something like, expr1 – (expr2 + expr3). You will do the same for all other expressions.

g.    The last expression is left without changing the bar offset. (This can be the expression with the lowest total).

9.  To style the chart, just go to the properties of the chart and change them as you deem necessary. By the end of this tutorial, you should have something like the below:


Reference


. 2016. . [ONLINE] Available at: http://source.entelect.co.za/creating-a-waterfall-effect-in-qlikview. [Accessed 11 March 2016].